
What if your procedures ran like a tube map?
Most procedures sit in thick documents nobody opens. Here is the other way: the whole business on one map, each step carrying its own risks and controls.
Overview
Procedures as a tube map, in brief
Most procedures live in documents. They are thick, split across files and versions, and out of date by the time anyone opens them. A long document is hard to change, so nobody changes it.
“I have rarely seen a procedure document stop a failure. I have seen a map do it.”
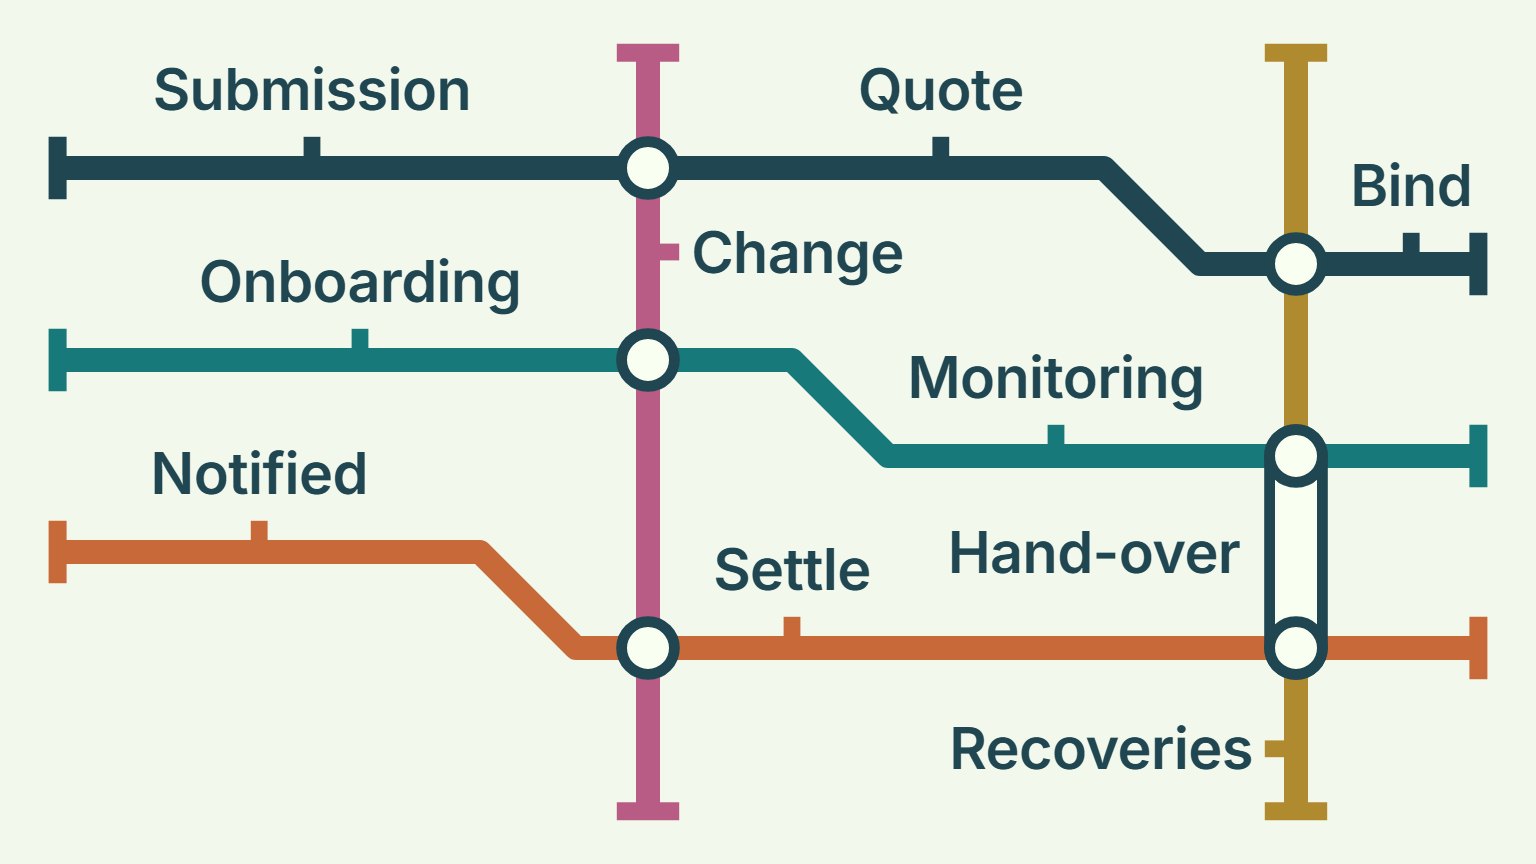
Now picture the business as a tube map. Every team runs a line. Every task is a stop, in the order the work happens. Each process is a flow, and each step carries its own risks and controls.
Business teams get procedures they can follow, that stay current and show who does what. Risk teams get one map to keep right.

Step by step
From the whole business to a single step
Here is the idea at work in Halden, our fictitious Lloyd's managing agent. We start with the whole business, follow one line, open a single step, then show where to start.
One mapWhere does a late bordereau end up?
The whole business on one map
What it shows
Halden's map has fourteen lines, one for each team, from Underwriting and Claims to Finance, Compliance and People. Read it top to bottom and the stages follow in the order the business runs.
Two coverholders send their bordereaux six weeks late. It looks like a delegated authority (DA) problem. But the same data feeds reserving in Claims, so the quarter's reserves for two binders rest on estimates.
On the map, you see that knock-on into Claims. Business teams see who to speak to. Risk teams see which other teams a failure hits.

One lineWhich stop needs attention?
Open a line, see its stops
What it shows
Open one line and you see its stops. Distribution runs from Brokers to Submission in six stops, in the order the work happens. At Submission it meets the Underwriting line, where the work hands over.
Problems are flagged on the stop where they sit. Here the DA oversight stop carries a flag: it needs attention. You see where the problem is without opening a single document.

One stepWhat sits behind a single step?
Open a stop, click a step
What it shows
Open the flagged DA oversight stop and it becomes a flow, from onboarding a coverholder to the renewal decision.
Click one step: receive and validate bordereaux. Its risks, controls and indicators sit on it, with who owns it, when it runs and the evidence it leaves.
When a control fails or an indicator moves outside its limits, you see which step needs attention. The step is the procedure, so there is far less to maintain. Risk, audit and regulatory reviews find the evidence already on the step.

Where to startWhy start from a blank page?
Start from a map we've already built
What it shows
We've already built one in CoVi Analytics, for a Lloyd's managing agent's whole business. Start where the pain is, often DA oversight or claims. Keep the steps that match how your teams work and change the ones that don't.
The controls on it are already mapped to the Lloyd's principles. So you can evidence your own mapping to them, and strengthen it where it is thin.
Then grow the map piece by piece: map one area, test it, move on. Results from week 3, not month 6.
A flow that flows with you.

If you're done with maintaining large procedure documents that add no value, let's have a chat.
We'll walk you through how it all comes together with Halden.
Learn more
Sources
- Halden, process map: the fourteen team lines, the Distribution line and the DA oversight flow.
- Halden, incident log: INC-033, binder bordereaux received six weeks late.