
See how close you are to each limit the board set.
Each statement the board set, measured by its indicators in CORE, with the risks and processes behind each one.
Shown on Halden, our fictitious Lloyd's managing agent. See how Halden runs it
Are we within appetite?
- 10Within
- 7Approaching
- 3Outside
- Large loss ratio to date18.1% · limit 18%Outside
- Out-of-authority binding23 · limit 15Outside
- Wording exceptions not approved4 · limit 2Outside
Appetite has to be shown in numbers, not only in words.
Our reading: as the market softens, a board needs to see how close each limit is while there is still time to act.
- Jan 2026 · Lloyd'sFor the Principles board attestation, managing agents should consider "not only a qualitative view but also what quantitative data is available to support the assessment".Source: Lloyd's, Principles Board Attestation: Guidance for 2026, p3 (opens in a new tab)
- 15 Jan 2026 · PRAThe PRA expects boards to hold underwriting discipline as the market weakens, and to price and reserve adequately.Source: PRA, Insurance Supervision: 2026 priorities, p4 (opens in a new tab)
- May 2026 · Lloyd'sLloyd's told the market: "Expectation for 2027 is not growth at any cost".Source: Lloyd's, Q2 2026 Market Messages, slide 16 (opens in a new tab)
What you get
-
See where you stand against appetite any day, not once a quarter.
Each statement is measured by the indicators that test it, so the board reads a status, not a paragraph.
- Today
- Appetite in prose, read at committee
- With CoVi Analytics
- Each statement measured, any day
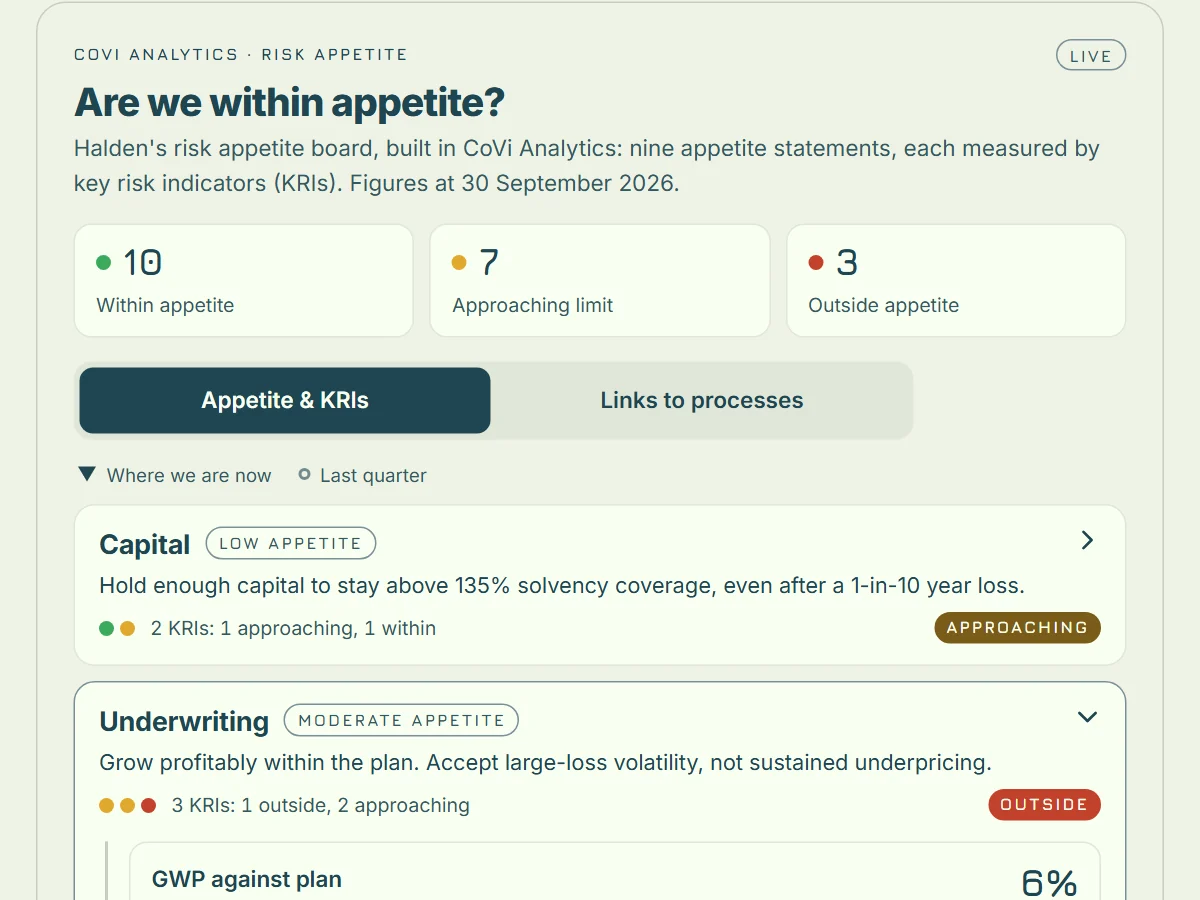
Halden's risk appetite report: nine statements, 20 indicators.
-
Spot an indicator nearing its limit before it becomes a breach.
Each indicator shows its amber and red marks, so the 7 nearing a limit at Halden stand out before they cross it.
- Today
- Seen once it is red
- With CoVi Analytics
- Seen while it is amber
Approaching the limitHalden · 3 of 7- Coverage after a 1-in-10 year loss128% · amber below 130%Approaching
- Casualty actual vs expected claims7% · amber above 5%Approaching
- Premium debt over 90 days4.2% of GWP · amber from 3%Approaching
-
Go from a red indicator to the risks behind it in one click.
Open any indicator to see the risks it watches, then switch views to see the processes where those risks arise.
- Today
- A red with no context
- With CoVi Analytics
- Each red opens onto its risks
From the appetite boardOut-of-authority binding · 23Outside- OR-06.1 Coverholder binding outside authorityRelated risk16 · High
- OR-06.3 Weak coverholder oversightRelated risk9 · Medium
- DA oversightProcess · distribution line1 failed control
Grow inside the appetite the board set.
The business sees how close it is to each limit, while there is still time to change course.
Bring your appetite statements. See them measured.
Tell us how your appetite and indicators are reported today, and leave knowing where to start.
We'll walk you through how it all comes together with Halden.